Descriptive Statistics and Correlations for the Yule Data
OUTRATIO
PROPOLD
POP
PAUP
OUTRATIO
1.0
--
--
--
PROPOLD
.109
1.0
--
--
POP
-.012
-.528
1.0
--
PAUP
.594
.395
-.593
1.0
Mean
25.156
99.188
119.969
50.344
Maximum
5.0
81.0
68.0
2223.0
Minimum
64.0
119.0
203.0
81.0
SD
12.796
9.107
30.248
16.488
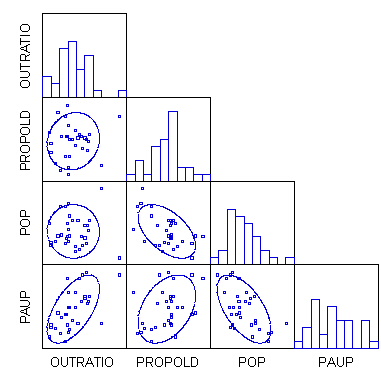
Scatterplot Matrix for Yule Data
12 Feb 2003